Fig. 9
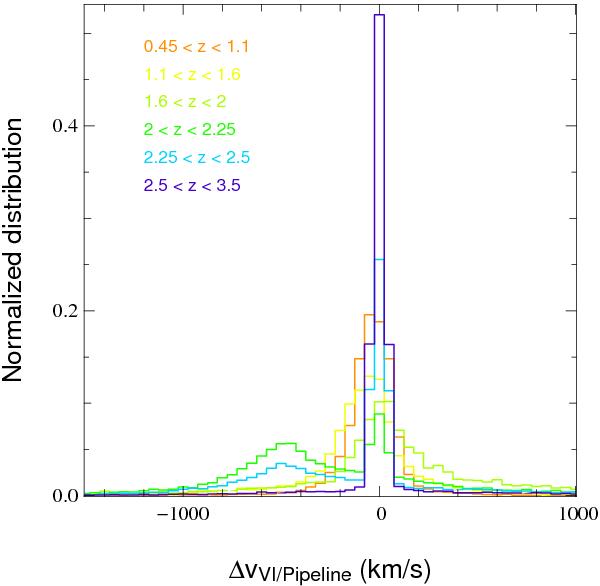
Normalized (to unit integral) distribution of the velocity difference between the pipeline and visual inspection redshift estimates for different redshift bins. About half of the pipeline redshifts are corrected during the visual inspection. Most of the corrections are for quasars with 2 < z < 2.5 where the Mg ii emission line is available and where the pipeline redshift estimate does not correspond to the peak of the Mg ii emission line.
Current usage metrics show cumulative count of Article Views (full-text article views including HTML views, PDF and ePub downloads, according to the available data) and Abstracts Views on Vision4Press platform.
Data correspond to usage on the plateform after 2015. The current usage metrics is available 48-96 hours after online publication and is updated daily on week days.
Initial download of the metrics may take a while.