Fig. 3
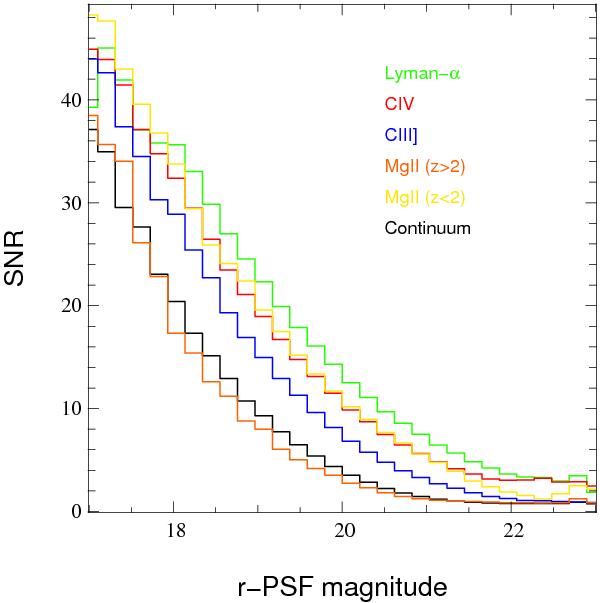
Median observed S/N per pixel at the top of the Lyman-α (green), C iv (red), C iii] complex (blue), Mg ii at z > 2 (orange) and Mg ii at z < 2 (yellow) emission lines and in emission-line free regions (black) versus r-PSF magnitude (corrected for Galactic extinction). Two redshift ranges are considered for Mg ii because the emission line is redshifted in regions of the spectra with very different characteristics. At r ~ 22, the median S/N per pixel at the top of the Lyman-α and C iv emission lines is about 4; sufficient to identify most of the quasars. Outside of the emission-line regions, at the same magnitude, the S/N per pixel is about unity.
Current usage metrics show cumulative count of Article Views (full-text article views including HTML views, PDF and ePub downloads, according to the available data) and Abstracts Views on Vision4Press platform.
Data correspond to usage on the plateform after 2015. The current usage metrics is available 48-96 hours after online publication and is updated daily on week days.
Initial download of the metrics may take a while.