Fig. 28
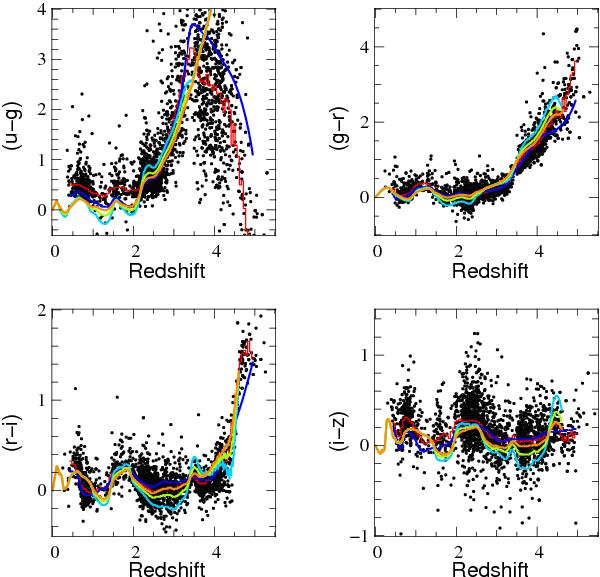
SDSS colors vs. redshift for quasars in the DR9Q catalog. The thin solid red line is the median color in bins of redshift. The thick color lines are models from simulations used to determine the BOSS quasar completeness (McGreer et al., in prep.; see also Ross et al., in prep.) for three different quasar luminosities: Mi [z = 2] = −22.49 (cyan), Mi [z = 2] = −24.99 (green) and Mi [z = 2] = −27.49 (orange); and empirical tracks for the DR7 quasars (blue Bovy et al. 2011). These simulations include the Baldwin effect (Baldwin 1977). Therefore the colors depend on the quasar luminosity. The model is systematically bluer than the data at low redshift because BOSS systematically excludes UV-excess sources.
Current usage metrics show cumulative count of Article Views (full-text article views including HTML views, PDF and ePub downloads, according to the available data) and Abstracts Views on Vision4Press platform.
Data correspond to usage on the plateform after 2015. The current usage metrics is available 48-96 hours after online publication and is updated daily on week days.
Initial download of the metrics may take a while.