Fig. 21
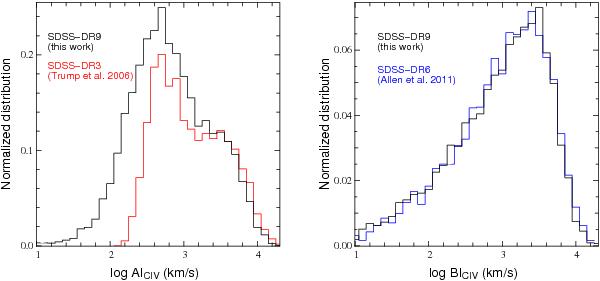
Left panel: distribution of AI from our automatic detection (black histogram) and from SDSS-DR3 (red histogram, Trump et al. 2006). The distributions are normalized for log AI > 3. The difference between the two results at low AI is a consequence of slightly different formula used to measure AI. Right panel: distribution of BI from our automatic detection (black histogram) and from SDSS-DR6 (blue histogram, Allen et al. 2011).
Current usage metrics show cumulative count of Article Views (full-text article views including HTML views, PDF and ePub downloads, according to the available data) and Abstracts Views on Vision4Press platform.
Data correspond to usage on the plateform after 2015. The current usage metrics is available 48-96 hours after online publication and is updated daily on week days.
Initial download of the metrics may take a while.