Fig. 19
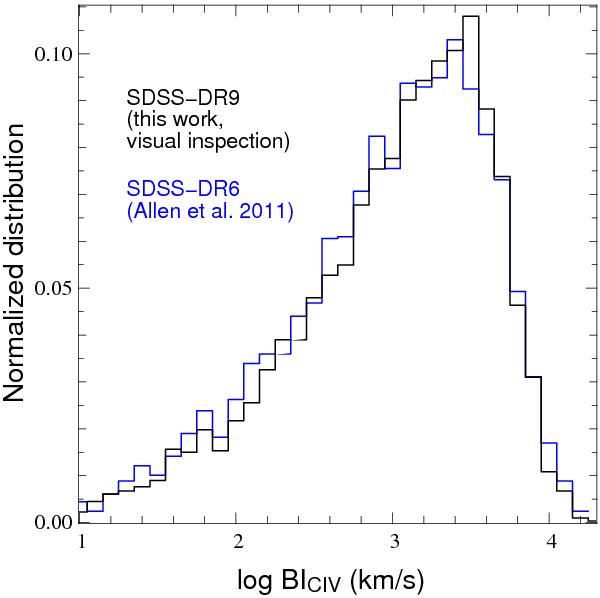
Normalized distributions of the logarithm of BI measured from C iv troughs. The BI distribution from the present catalog (black histogram) computed from 7227 visually flagged BAL quasars is very similar to the distribution from Trump et al. (2006, red histogram) obtained from 1102 BAL quasars from the SDSS-DR3 quasar catalog (Schneider et al. 2005). The distribution is also very similar to the BI distribution from Allen et al. (2011, blue histogram) based on the SDSS-DR6 quasar catalog.
Current usage metrics show cumulative count of Article Views (full-text article views including HTML views, PDF and ePub downloads, according to the available data) and Abstracts Views on Vision4Press platform.
Data correspond to usage on the plateform after 2015. The current usage metrics is available 48-96 hours after online publication and is updated daily on week days.
Initial download of the metrics may take a while.