Fig. 17
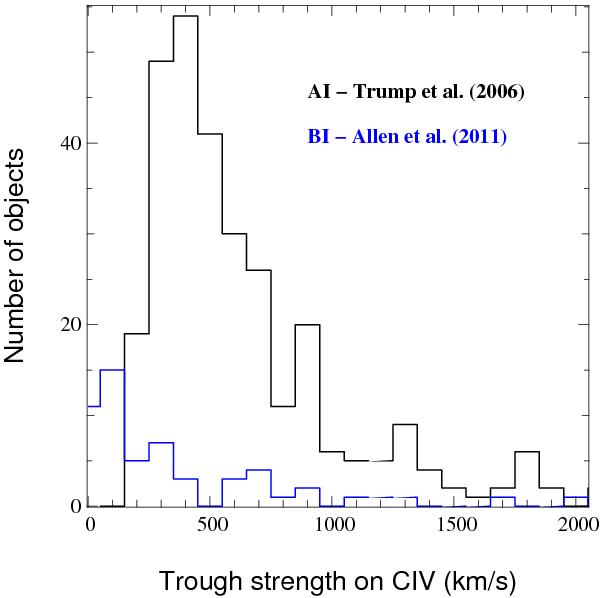
Distribution of BI and AI for quasars detected as BAL by automatic procedures in previous SDSS releases, and that were not flagged by the visual inspection of the BOSS spectra. The black histogram shows the distribution of AI as measured by Trump et al. (2006) for 296 such quasars (all have BI = 0). About half of them are not real BALs (see text). From the automatic detection by Allen et al. (2011) (blue histogram), 57 quasars were missed by the visual inspection. Here again, only a handful of these objects actually display BAL troughs.
Current usage metrics show cumulative count of Article Views (full-text article views including HTML views, PDF and ePub downloads, according to the available data) and Abstracts Views on Vision4Press platform.
Data correspond to usage on the plateform after 2015. The current usage metrics is available 48-96 hours after online publication and is updated daily on week days.
Initial download of the metrics may take a while.