Free Access
Fig. 13
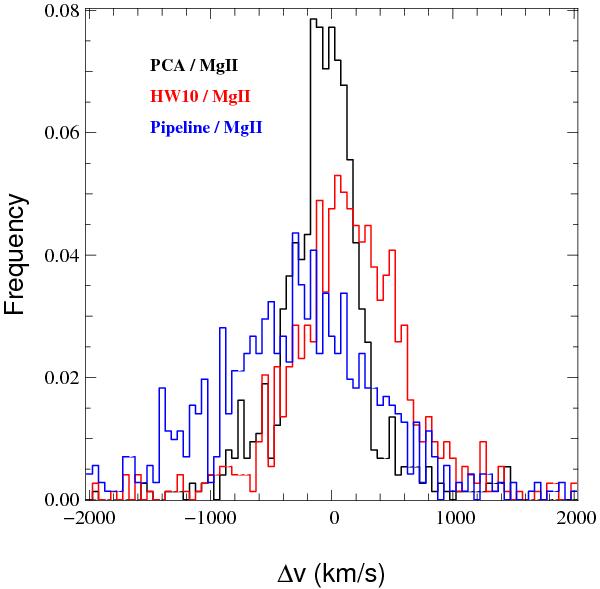
Normalized distributions of the velocity difference between our global PCA redshift estimate (black histogram), the pipeline redshift estimate (blue histogram) or Hewett & Wild (2010) redshifts (red histogram) with the redshift derived from a PCA fit of the Mg ii emission line (see text).
Current usage metrics show cumulative count of Article Views (full-text article views including HTML views, PDF and ePub downloads, according to the available data) and Abstracts Views on Vision4Press platform.
Data correspond to usage on the plateform after 2015. The current usage metrics is available 48-96 hours after online publication and is updated daily on week days.
Initial download of the metrics may take a while.