Fig. 10
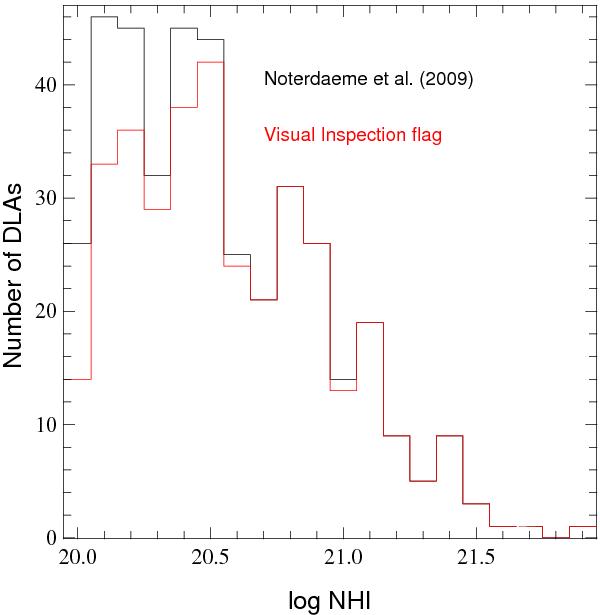
H i column density distribution for DLAs and sub-DLAs detected by Noterdaeme et al. (2009) in quasars observed both by SDSS-DR7 and BOSS (black histogram). The red histogram displays the same distribution but for DLAs flagged after visual inspection of BOSS spectra. This shows that the visual inspection is robust for log N(H i) > 20.3, the standard definition of DLAs.
Current usage metrics show cumulative count of Article Views (full-text article views including HTML views, PDF and ePub downloads, according to the available data) and Abstracts Views on Vision4Press platform.
Data correspond to usage on the plateform after 2015. The current usage metrics is available 48-96 hours after online publication and is updated daily on week days.
Initial download of the metrics may take a while.