Fig. 1
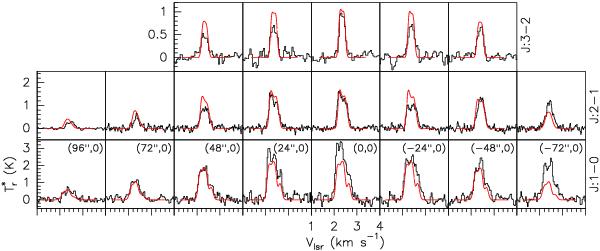
DCO+ observations (histogram) and fit (red line) for J:1–0 (bottom line), J:2–1 (middle line), and J:3–2 (top line) across L183 main PSC. Offsets are indicated for the J:1–0 transition and apply to all. The cut, though sparcely sampled for the J:2–1 and J:3–2 lines, is along the same N2H+ cut as in Paper I and crosses the dust peak.
Current usage metrics show cumulative count of Article Views (full-text article views including HTML views, PDF and ePub downloads, according to the available data) and Abstracts Views on Vision4Press platform.
Data correspond to usage on the plateform after 2015. The current usage metrics is available 48-96 hours after online publication and is updated daily on week days.
Initial download of the metrics may take a while.