Fig. 6
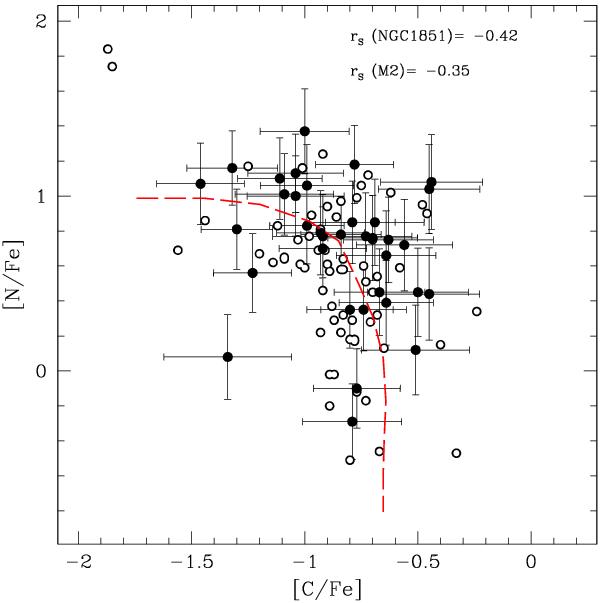
Derived [N/Fe] abundances for M 2 stars in Table 4 as a function of the [C/Fe] abundances from our sample (filled circles). A C vs. N anticorrelation is apparent. For comparison we also plotted our previous results on a sample of MS and SGB stars in the cluster NGC 1851 (white dots). The red dashed line indicates the relationship, shown over its full range, that prevails in NGC 1851 from our earlier work.
Current usage metrics show cumulative count of Article Views (full-text article views including HTML views, PDF and ePub downloads, according to the available data) and Abstracts Views on Vision4Press platform.
Data correspond to usage on the plateform after 2015. The current usage metrics is available 48-96 hours after online publication and is updated daily on week days.
Initial download of the metrics may take a while.