Fig. 5
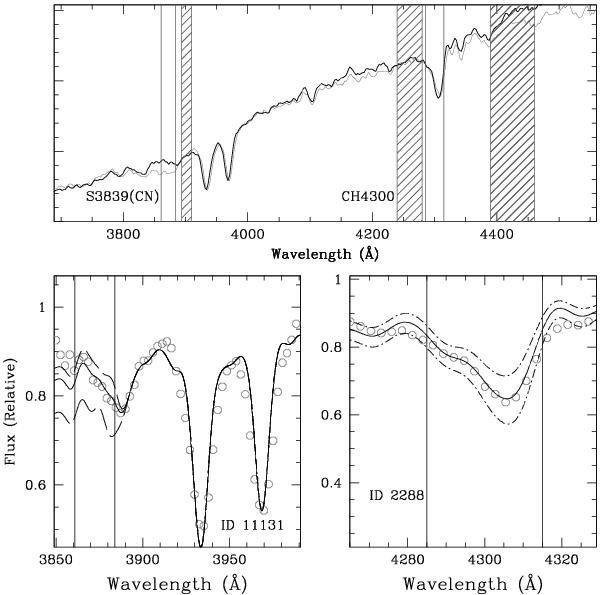
Top panel: DOLORES-LRB spectra of the stars 17116 (gray) and 18369 (black) in the region of the CN UV feature and CH band. The stars are essentially identical in V magnitude (V = 15.86,15.94, respectively), (U − V) color ((U − V) = 1.06 and 0.95, respectively), and C abundance (see Table 4). The gray shaded regions show the continuum regions, while the solid gray lines show the window from which we measured the CN and CH indices. Bottom panels: observed (gray empty circles) and synthetic (line) spectra around the CN and CH band for the stars 11131 and 2288 stars, respectively. The solid line represents the best fit, while the dashed-dotted lines are the synthetic spectra computed with the derived C abundance altered by ± 0.2 dex and N abundance altered by ± 0.5 dex from the best value. Vertical lines show the location of the CN (3861 Å to 3884 Å) and CH (4285 Å to 4315 Å absorption bandpass.
Current usage metrics show cumulative count of Article Views (full-text article views including HTML views, PDF and ePub downloads, according to the available data) and Abstracts Views on Vision4Press platform.
Data correspond to usage on the plateform after 2015. The current usage metrics is available 48-96 hours after online publication and is updated daily on week days.
Initial download of the metrics may take a while.