Fig. 2
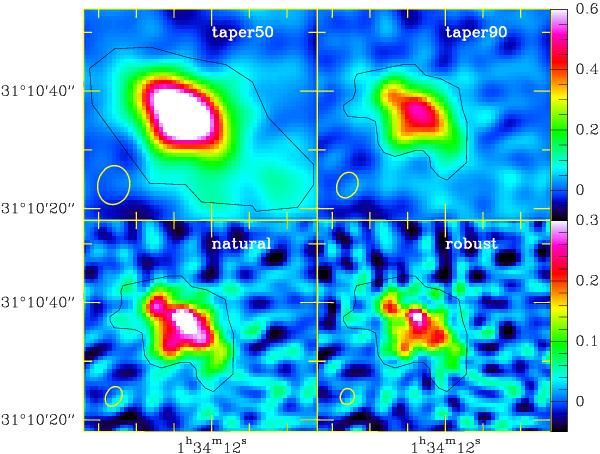
Morphology of the outer disk cloud; shown are the moment zero or integrated intensity maps made with the tapered, natural, and robust weighting. The beam sizes are indicated as ellipses in the lower left corner of each map. The color scales are shown to the right for the tapered and untapered images separately and are in units of Jy/beam. The extended emission contour is shown in the upper left box and the cloud contour is drawn in the other panels. These two contours are used to compute the fluxes given in Table 1.
Current usage metrics show cumulative count of Article Views (full-text article views including HTML views, PDF and ePub downloads, according to the available data) and Abstracts Views on Vision4Press platform.
Data correspond to usage on the plateform after 2015. The current usage metrics is available 48-96 hours after online publication and is updated daily on week days.
Initial download of the metrics may take a while.