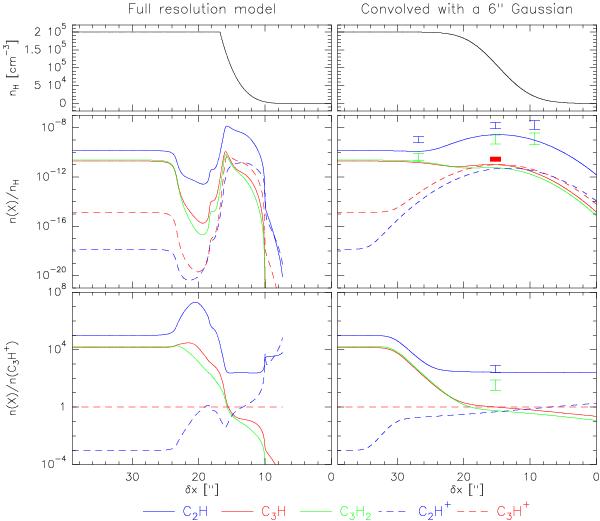
Fig. 5

Photochemical model of the Horsehead PDR displayed at the full resolution of the model (left column) and convolved with a Gaussian of 6′′-FWHM (right column). Top: Horsehead density profile nH = n(H) + 2n(H2). Middle: predicted abundance of selected small hydrocarbons molecules and cations. Bottom: abundances of the same hydrocarbons relative to the abundance of C3H+. The illuminating star is positioned at the right of the plots. The symbols present the measured range of possible abundances for C2H (blue vertical segment), C3H2 (green vertical segment), and C3H+ (red filled rectangle), inferred at a typical resolution of 6′′. The legend at the bottom of the figure presents the line coding for the curves: C2H in plain blue, C2H+ in dashed blue, C3H in plain red, C3H+ in dashed red, and C3H2 in green.
Current usage metrics show cumulative count of Article Views (full-text article views including HTML views, PDF and ePub downloads, according to the available data) and Abstracts Views on Vision4Press platform.
Data correspond to usage on the plateform after 2015. The current usage metrics is available 48-96 hours after online publication and is updated daily on week days.
Initial download of the metrics may take a while.


