Fig. 3
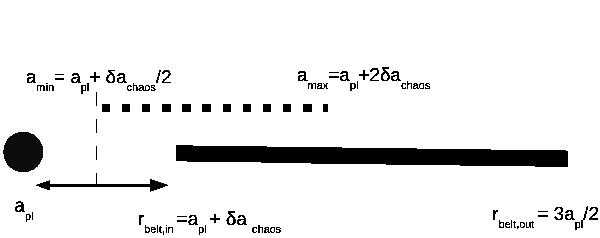
Diagram to illustrate the set-up of our simulations. The large circle represents the planet, at apl. The real belt, at late times, is shown by the thick line between rbelt,in = apl,out + δachaos to  . To simulate this belt we need only consider test particles that start between
  and amax = apl,out + 2δachaos, represented by the dotted, thick line.
Current usage metrics show cumulative count of Article Views (full-text article views including HTML views, PDF and ePub downloads, according to the available data) and Abstracts Views on Vision4Press platform.
Data correspond to usage on the plateform after 2015. The current usage metrics is available 48-96 hours after online publication and is updated daily on week days.
Initial download of the metrics may take a while.