Fig. 2
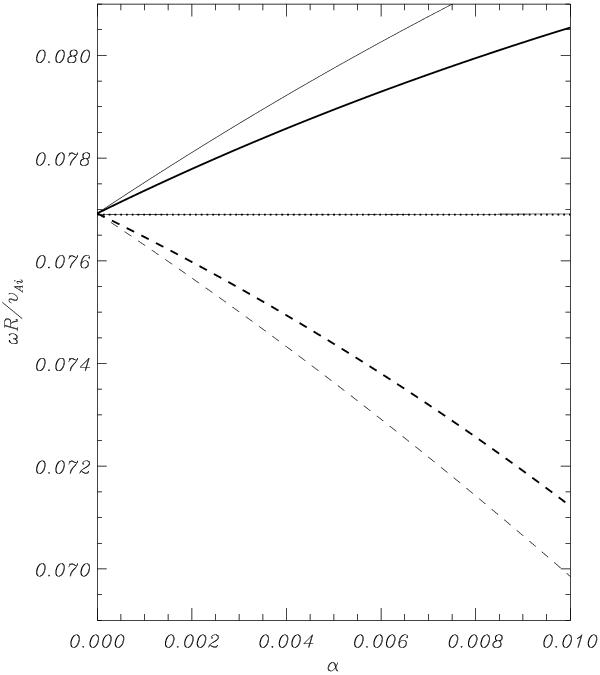
Frequency as a function of twist (α). For this particular example, ρi/ρe = 3, p = 1/2, q = 3/2 represented with thick lines while the case p = 0, q = 2 is plotted with thin lines. The dotted line represents the solution for the untwisted case. The horizontal continuous line is obtained by numerically solving the eigenvalue problem in 2D. The same notation as in Fig. 1 is used.
Current usage metrics show cumulative count of Article Views (full-text article views including HTML views, PDF and ePub downloads, according to the available data) and Abstracts Views on Vision4Press platform.
Data correspond to usage on the plateform after 2015. The current usage metrics is available 48-96 hours after online publication and is updated daily on week days.
Initial download of the metrics may take a while.