Fig. 1
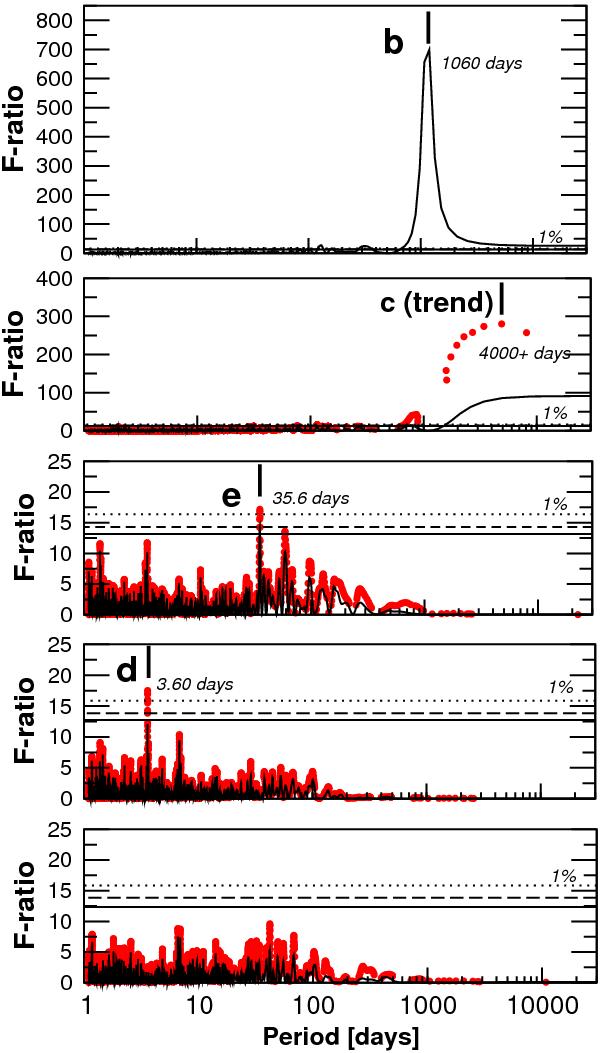
Detection periodograms from most significant signal to less significant one (top to bottom). Black lines are least-squares periodograms computed on the residuals to the k-planet model. The red dots represent the refined orbital solution with k + 1-planets at each test period as obtained by the recursive periodogram. The resulting sampling of the red dots is not uniform in frequency because the tested k + 1 period is also allowed to adjust.
Current usage metrics show cumulative count of Article Views (full-text article views including HTML views, PDF and ePub downloads, according to the available data) and Abstracts Views on Vision4Press platform.
Data correspond to usage on the plateform after 2015. The current usage metrics is available 48-96 hours after online publication and is updated daily on week days.
Initial download of the metrics may take a while.