Fig. 7
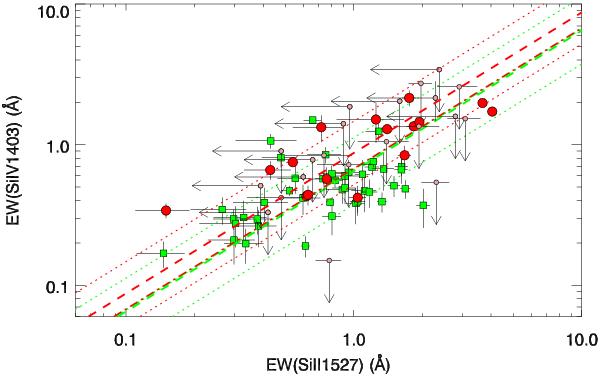
Si ivλ1403 vs. Si iiλ1527. Red dots are from GRB spectra whereas green boxes are from quasar intervening DLA systems. For clarity, detection limits are only plotted for GRBs. Dashed lines are the average values of the line ratios (detection limits are ignored), dotted are the standard deviation of these values and dashed-dotted lines are the ratios of the average values of the distributions. See Table 8 for a summary of the line ratios.
Current usage metrics show cumulative count of Article Views (full-text article views including HTML views, PDF and ePub downloads, according to the available data) and Abstracts Views on Vision4Press platform.
Data correspond to usage on the plateform after 2015. The current usage metrics is available 48-96 hours after online publication and is updated daily on week days.
Initial download of the metrics may take a while.