Fig. 3
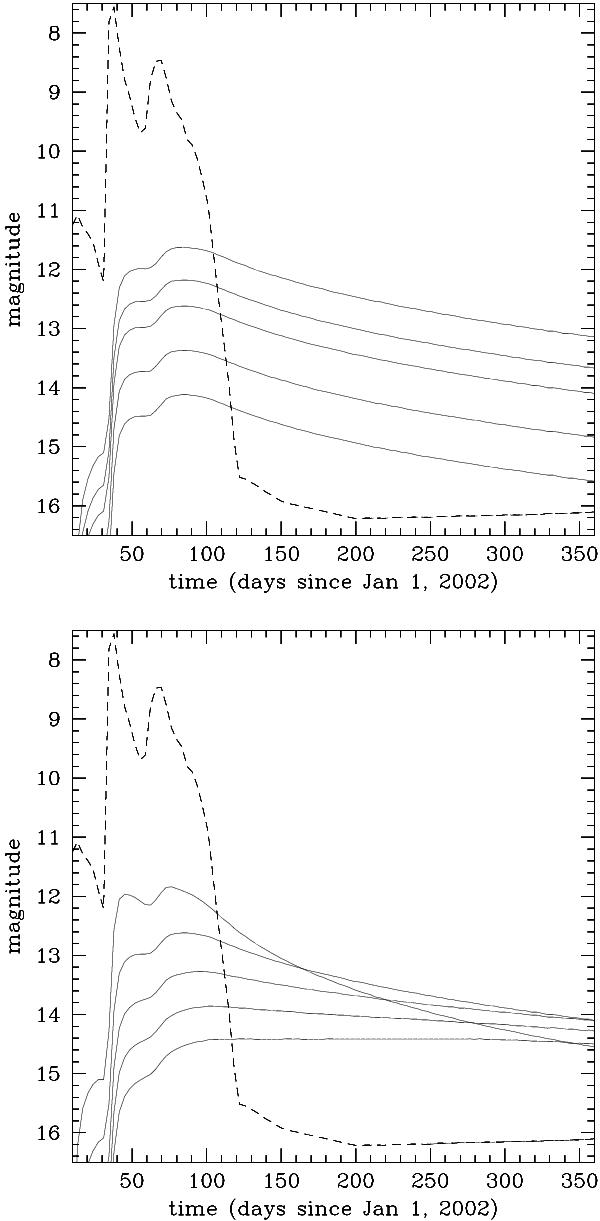
Evolution of the model echo total flux (in the magnitude scale) as a function of the optical thickness, τ0, along the line of sight of the central source (upper panel) and the anisotropy factor, ⟨ cosθ ⟩ , (bottom panel). Dashed curve in both panels: the light curve of the central source (the same as in the upper panel of Fig. 4). Full curves in the upper panel: the light echo flux evolution with ⟨ cosθ ⟩ fixed at 0.6 but for τ0 varying from 0.05 (bottom curve), through 0.1, 0.2, 0.3, and 0.5 (uppermost curve). Full curves in the bottom panel: the light echo flux evolution with τ0 fixed at 0.2 but for ⟨ cosθ ⟩ varying from 0.0 (bottom curve), through 0.2, 0.4, 0.6, and 0.8 (uppermost curve)
Current usage metrics show cumulative count of Article Views (full-text article views including HTML views, PDF and ePub downloads, according to the available data) and Abstracts Views on Vision4Press platform.
Data correspond to usage on the plateform after 2015. The current usage metrics is available 48-96 hours after online publication and is updated daily on week days.
Initial download of the metrics may take a while.