Fig. 9
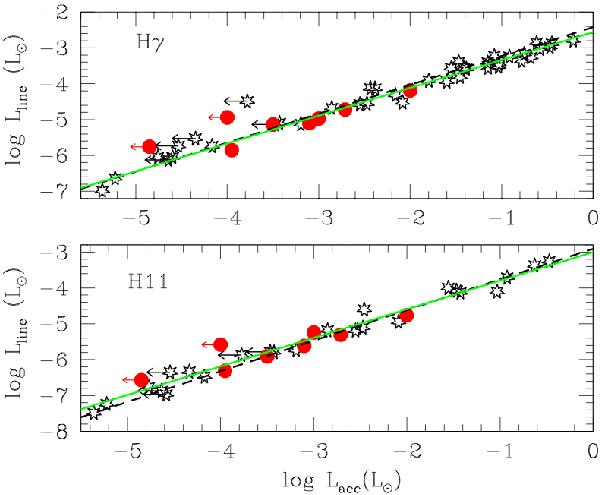
Relationship between selected line luminosities and the accretion continuum luminosity. The red dots and arrows are the sample analyzed in this paper, the black asterisks refer to the sample analyzed by HH08, where they found the relation drawn as black line. The green solid line corresponds to the relation found using the actual detection of our sample as well.
Current usage metrics show cumulative count of Article Views (full-text article views including HTML views, PDF and ePub downloads, according to the available data) and Abstracts Views on Vision4Press platform.
Data correspond to usage on the plateform after 2015. The current usage metrics is available 48-96 hours after online publication and is updated daily on week days.
Initial download of the metrics may take a while.