Free Access
Fig. 5
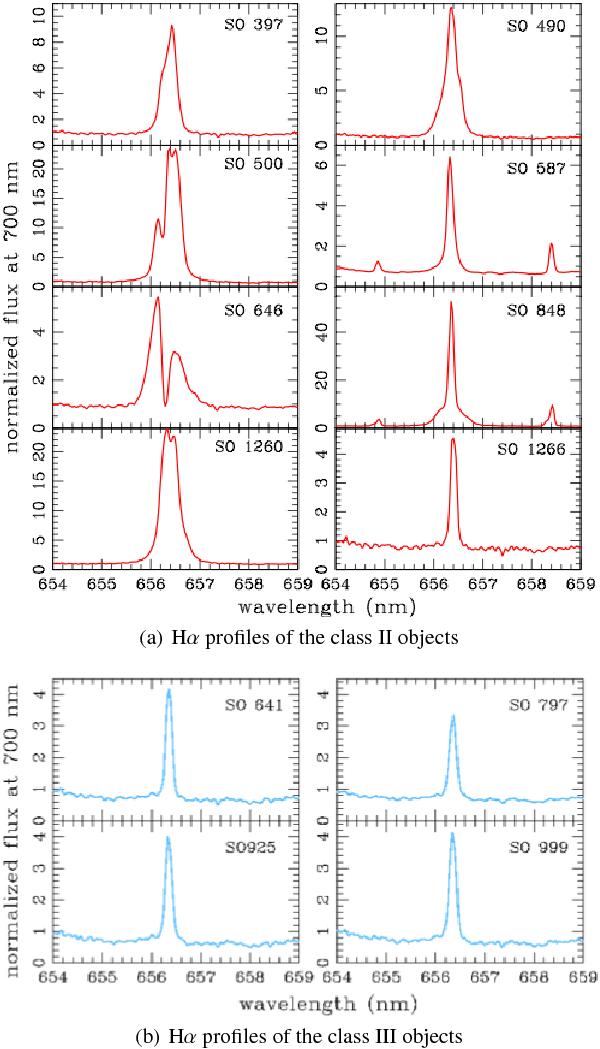
Hα line profiles normalized at 700 nm (class II red lines, panel a), and class III cyan lines, panel b)). The class II line profiles exhibit diverse morphologies that presumably arise from differing accretion rate values, gas temperature, and geometries (inclinations and magnetospheric radii).
This figure is made of several images, please see below:
Current usage metrics show cumulative count of Article Views (full-text article views including HTML views, PDF and ePub downloads, according to the available data) and Abstracts Views on Vision4Press platform.
Data correspond to usage on the plateform after 2015. The current usage metrics is available 48-96 hours after online publication and is updated daily on week days.
Initial download of the metrics may take a while.