Free Access
Fig. 4
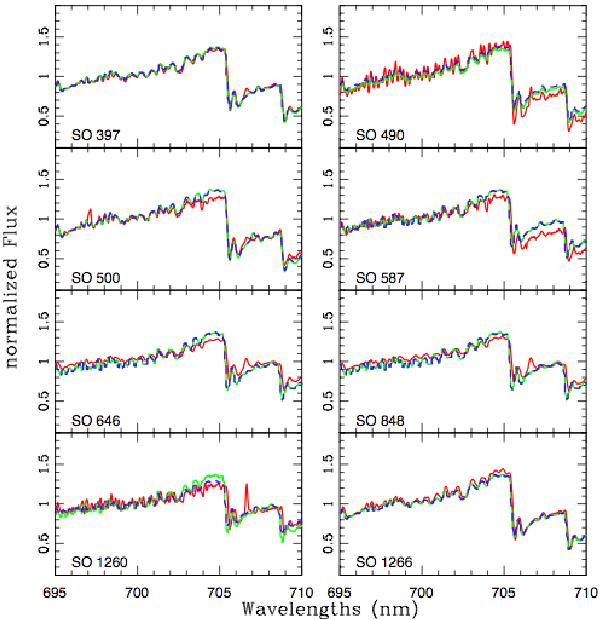
Region around 700 nm. The red-solid lines shows the class II spectra, the green line shows the spectrum of the adopted class III template and the blue-dashed line the adopted model with the emission added to the template.
Current usage metrics show cumulative count of Article Views (full-text article views including HTML views, PDF and ePub downloads, according to the available data) and Abstracts Views on Vision4Press platform.
Data correspond to usage on the plateform after 2015. The current usage metrics is available 48-96 hours after online publication and is updated daily on week days.
Initial download of the metrics may take a while.