Fig. 11
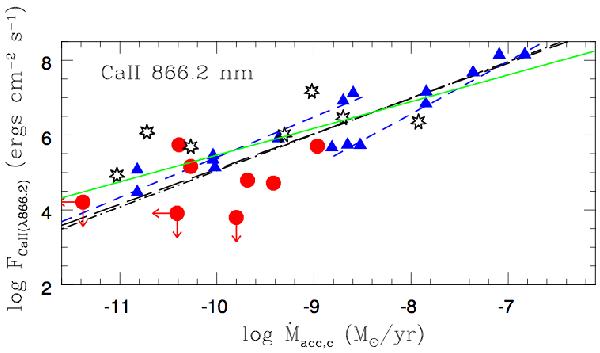
Ṁacc,c versus flux of the CaII λ866.2 line. The blue triangles and the blue lines (long- and short-dashed) represent the data set and the correlation found by Mohanty et al. (2005). The black asterisk are the sample taken into account by HH08 and the blue dotted-dashed lines are the relationships found in their paper. The red points are the objects analyzed in this paper. The green solid line is the least square fit of all the targets plotted in the figure, neglecting the upper limits.
Current usage metrics show cumulative count of Article Views (full-text article views including HTML views, PDF and ePub downloads, according to the available data) and Abstracts Views on Vision4Press platform.
Data correspond to usage on the plateform after 2015. The current usage metrics is available 48-96 hours after online publication and is updated daily on week days.
Initial download of the metrics may take a while.