Fig. 8
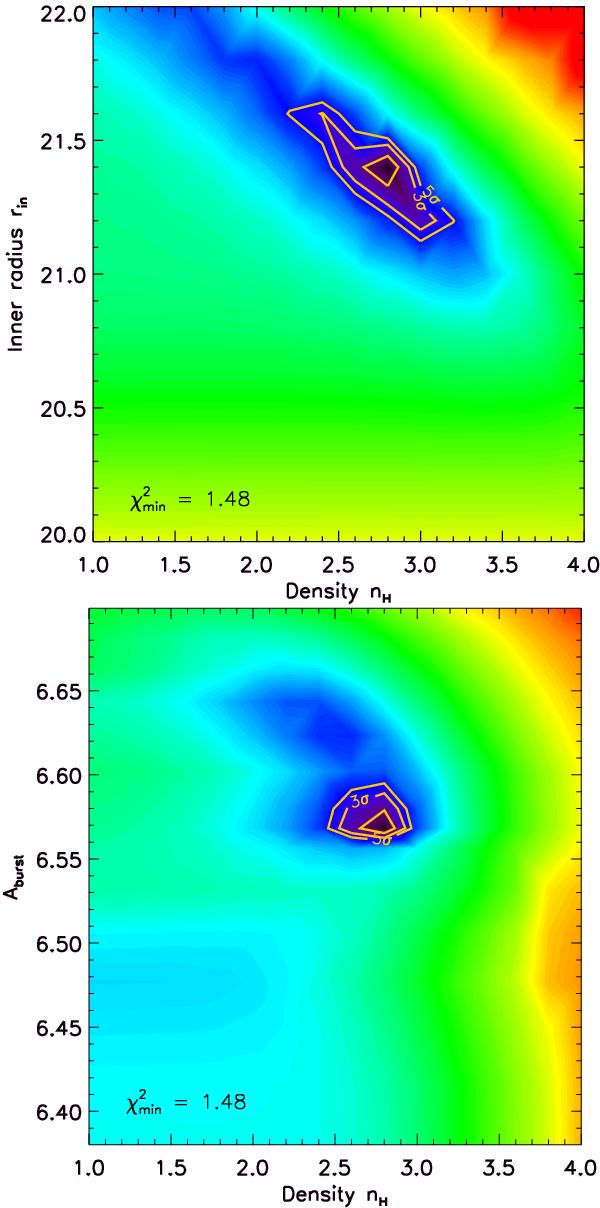
Contour plots of the χ2 values of the 3D grid (log scale). The parameters are given in logarithmic values. Units are cm-3 for the density, yr for the burst age, and cm for the inner radius. The minimum reduced χ2 found for CHII is  . Contour levels at 1-σ, 3-σ, and 5-σ from the minimum χ2 are displayed in orange. There are 5 other models within 3-σ of
  . The red color on the plots correspond to >1000-σ level. Top: χ2 contours in the nH-rin plane, for Aburst = 3.7 Myr (or 6.57 in log). Bottom: χ2 contours in the nH-Aburst plane, for rin = 1021.4 cm. (This figure is available in color in electronic form.)
Current usage metrics show cumulative count of Article Views (full-text article views including HTML views, PDF and ePub downloads, according to the available data) and Abstracts Views on Vision4Press platform.
Data correspond to usage on the plateform after 2015. The current usage metrics is available 48-96 hours after online publication and is updated daily on week days.
Initial download of the metrics may take a while.