Fig. 6
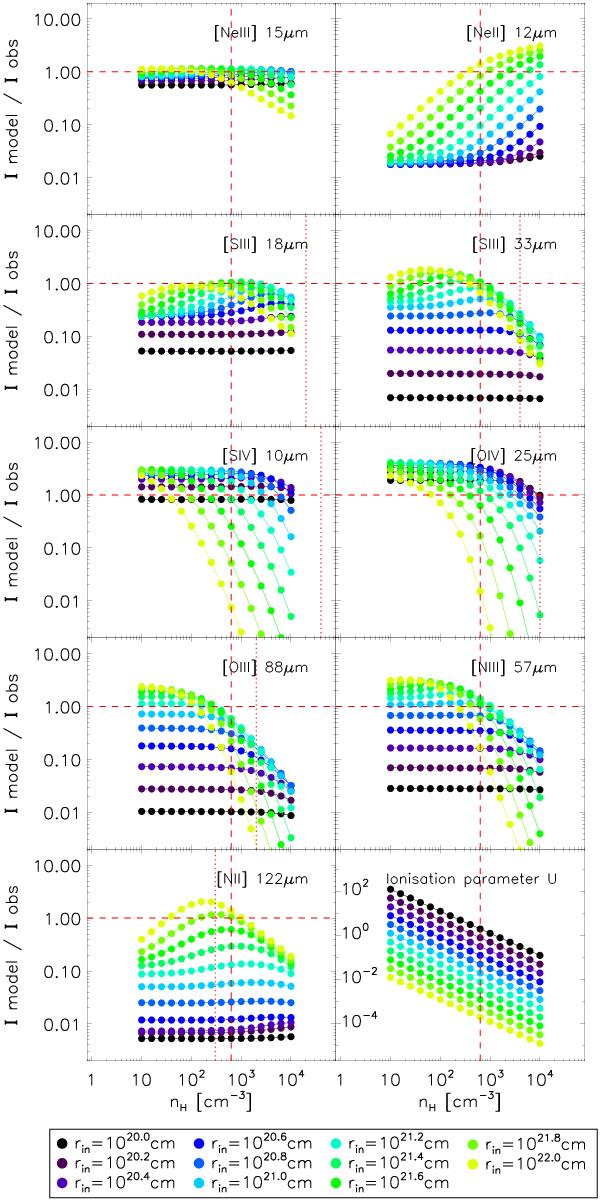
Predicted intensities for model C (Imodel) normalised by their observed value (Iobs) for all ionic lines considered, as a function of nH and rin for a given starburst age (of 3.7 Myr). The vertical dashed line shows the best fit model density nH = 102.8 cm-3, and the vertical dotted line the critical density of the ionic specie, if within the range displayed. The best fit inner radius is rin = 1021.4 cm (green symbols). (This figure is available in color in electronic form.)
Current usage metrics show cumulative count of Article Views (full-text article views including HTML views, PDF and ePub downloads, according to the available data) and Abstracts Views on Vision4Press platform.
Data correspond to usage on the plateform after 2015. The current usage metrics is available 48-96 hours after online publication and is updated daily on week days.
Initial download of the metrics may take a while.