Fig. 6
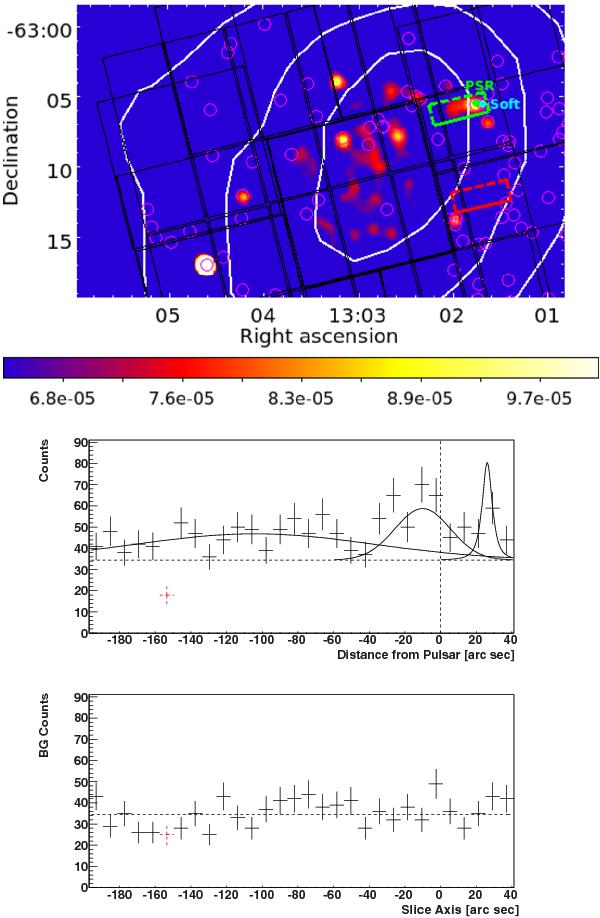
Smoothed, exposure corrected XMM-Newton X-ray flux map (cm-2 s-1) in the 2–8 keV energy band (top) The horizontal axis is Right Ascension and the vertical axis is Declination in J2000.0 coordinates. An extended X-ray source appears from the position of the pulsar, PSR J1301−6305 (green dot), and extends roughly in the direction of the center of the H.E.S.S. source (white contours show 8, 14 and 20σγ-ray significance). Chip edges are shown in black for all three detectors and XMM catalog sources are shown in magenta. The green box shows the slice used to create the profile (middle) and the red box shows the slice used for background estimation (bottom). Both slices were taken from the un-exposure corrected count map. A presumably unrelated soft point source, 2XMM J130141.3−630535, is shown in the map as a cyan dot. The excess was simultaneously fit with two Gaussians (the “compact region” near the pulsar position plus the “diffuse region” left of the pulsar) a King profile for the unrelated soft source to the right of the pulsar position and a constant background from the bottom slice. The red dotted bins in the projections lie directly on a chip edge in the pn camera in both slices and are excluded from the analysis. The dashed horizontal line indicates the fitted background level.
Current usage metrics show cumulative count of Article Views (full-text article views including HTML views, PDF and ePub downloads, according to the available data) and Abstracts Views on Vision4Press platform.
Data correspond to usage on the plateform after 2015. The current usage metrics is available 48-96 hours after online publication and is updated daily on week days.
Initial download of the metrics may take a while.