Fig. 5
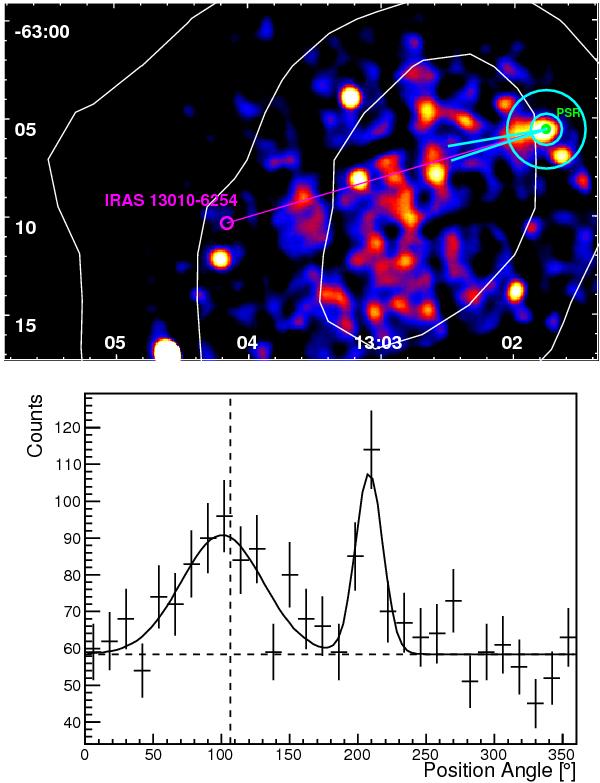
Top: the 2–8 keV XMM-Newton X-ray count map in the region of the pulsar smoothed by a Gaussian kernel of width σ = 40′′. The horizontal axis is Right Ascension and vertical axis is Declination in J2000.0 coordinates. The count map is not exposure corrected, thus the apparent enhanced emission near the center is only an artifact. Overlaid is the projection annulus, shown in cyan, used to determine the direction of the X-ray extension, with inner radius of 48′′ and outer radius of 120′′, centered on the pulsar position. The 8, 14 and 20σ TeV significance contours are shown in white. The direction of the extension is found to be within 1σ from the direction of the star formation region, IRAS 13010−6254, located at a position angle of 106.3°, indicated by a magenta line in the sky map and a dashed line in the projection. The cyan lines in the sky map show the 1σ errors in the fitted direction of the extension. Bottom: the X-ray azimuthal projection in position angle from the pulsar location. The projected on-counts were fitted with the sum of a Gaussian and a flat background giving a position angle of 101.5° ± 5.3° and a Gaussian width of 30° ± 7°. The point source located at ~210° is an unidentified X-ray source.
Current usage metrics show cumulative count of Article Views (full-text article views including HTML views, PDF and ePub downloads, according to the available data) and Abstracts Views on Vision4Press platform.
Data correspond to usage on the plateform after 2015. The current usage metrics is available 48-96 hours after online publication and is updated daily on week days.
Initial download of the metrics may take a while.