Fig. 2
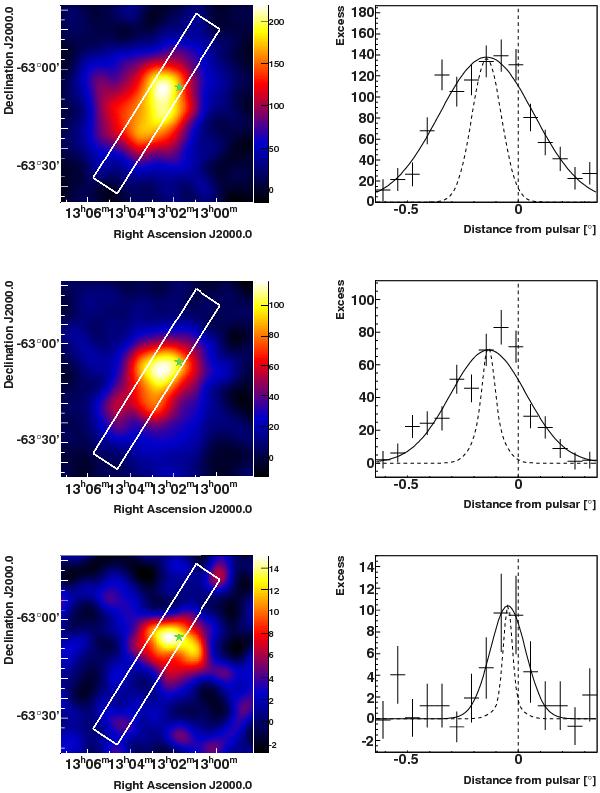
Left: uncorrolated excess images of the HESS J1303−631 region in the energy bands E1 = (0.84−2) TeV, E2 = (2−10) TeV and E3 > 10 TeV (from top to bottom). Coordinates are J2000.0. All images were smoothed with a Gaussian kernel of width 0.05°. Slices are indicated by the rectangles, taken in the direction of the semi-major axis of the fitted asymmetric Gaussian function. Right: the slices on the uncorrelated excess images are then fitted with a Gaussian function. The pulsar position is marked by a green star in the sky maps and a dashed line in the profiles. The dashed curves show the energy-dependent PSF of the H.E.S.S. instrument.
Current usage metrics show cumulative count of Article Views (full-text article views including HTML views, PDF and ePub downloads, according to the available data) and Abstracts Views on Vision4Press platform.
Data correspond to usage on the plateform after 2015. The current usage metrics is available 48-96 hours after online publication and is updated daily on week days.
Initial download of the metrics may take a while.