Free Access
Fig. 8
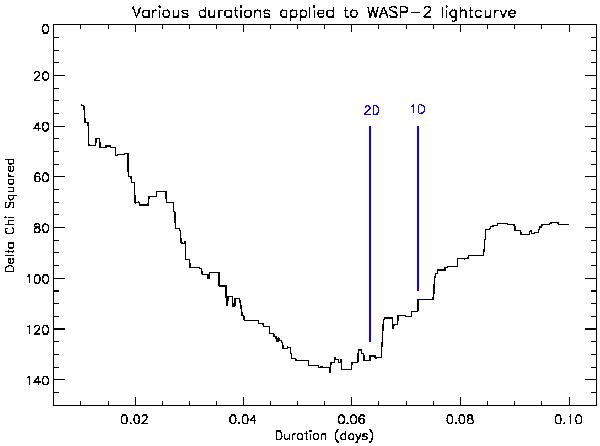
Plot showing the Δχ2 from a flat distribution of various transit durations, with depth optimally fitted for each duration. The 2D algorithm results in a longer duration, and therefore less significant event, than the 3D approaches which vary the durations searched over.
Current usage metrics show cumulative count of Article Views (full-text article views including HTML views, PDF and ePub downloads, according to the available data) and Abstracts Views on Vision4Press platform.
Data correspond to usage on the plateform after 2015. The current usage metrics is available 48-96 hours after online publication and is updated daily on week days.
Initial download of the metrics may take a while.