Fig. 11
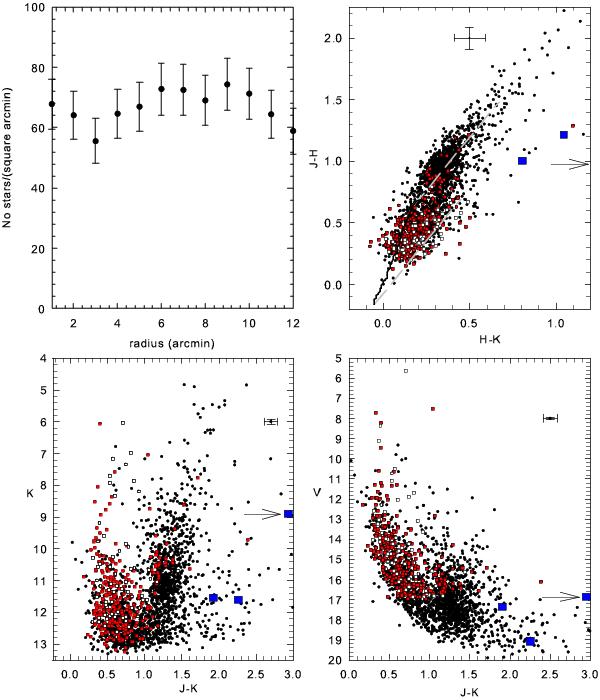
Radial density profile in the region of Trumpler 27, upper left panel. Bars are Poisson errors. The (J − H),(H − K) color–color diagram of all stars in the region is shown in the upper right panel. White and red squares are stars in Tables 2 and 3, respectively. The cross indicates the average color errors. Large blue squares give the position of the YSO candidates, and the arrow points out the position of the star N. 1796 outside the diagram limits. Solid black line is the intrinsic relation from Koornneef (1983); the two gray dashed lines are color excesses relations for AV = 6 mag for early- and late-type stars. The lower left and right panels show the K,(J − K) and V,(J − K) color–magnitude diagrams. Symbols as in the upper right panel.
Current usage metrics show cumulative count of Article Views (full-text article views including HTML views, PDF and ePub downloads, according to the available data) and Abstracts Views on Vision4Press platform.
Data correspond to usage on the plateform after 2015. The current usage metrics is available 48-96 hours after online publication and is updated daily on week days.
Initial download of the metrics may take a while.