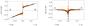
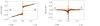
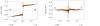
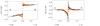
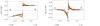
Fig. 6

Measurement of the FeI 630.1 nm line core formation depth δ/sinθ (θ denotes the heliocentric angle). Left column, from top panel to bottom panel: center-to-limb variations of the formation depth of the images at line cord levels 1 to 5 (orange dots), and their linear fit with the a and b coefficients given in Table 1 (black dots). Right column: difference between the measured values of δ/sinθ and their linear fit (orange dots) and analytical fit of this difference with the c and d coefficients given in Table 1 (black dots). Results obtained in the southern hemisphere (denoted by S on the figures) are shown as functions of the variable −1 + μ, whereas results obtained in the northern hemisphere (denoted by N) are shown are as functions of 1 − μ.
Current usage metrics show cumulative count of Article Views (full-text article views including HTML views, PDF and ePub downloads, according to the available data) and Abstracts Views on Vision4Press platform.
Data correspond to usage on the plateform after 2015. The current usage metrics is available 48-96 hours after online publication and is updated daily on week days.
Initial download of the metrics may take a while.