Fig. 5
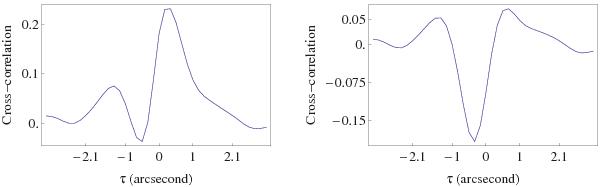
Illustration of the subtraction of the positive peak from the cross-correlation. Left panel: north-south cut of the cross-correlation, IC(τ), of the image at line cord level 5 in the FeI line at 603.15 nm, with the image at the continuum level, for μ = 0.82. The negative peak of cross-correlation arising from the contrast inversion of the images is partly blended with the positive peak. Right panel: result of the subtraction IC(τ) − αC(τ), with α = 0.12. We notice the shift of the negative peak when the correction is applied.
Current usage metrics show cumulative count of Article Views (full-text article views including HTML views, PDF and ePub downloads, according to the available data) and Abstracts Views on Vision4Press platform.
Data correspond to usage on the plateform after 2015. The current usage metrics is available 48-96 hours after online publication and is updated daily on week days.
Initial download of the metrics may take a while.