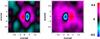
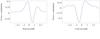
Fig. 4

2D cross-correlation of the images at line center and at the continuum level for μ = 0.3, in the northern hemisphere (left panel) and in the southern hemisphere (right panel). The south-north direction is along the horizontal axis. Lower left and right panels: south-north cuts, IC(τ), of the cross-correlations shown in the upper panels.
Current usage metrics show cumulative count of Article Views (full-text article views including HTML views, PDF and ePub downloads, according to the available data) and Abstracts Views on Vision4Press platform.
Data correspond to usage on the plateform after 2015. The current usage metrics is available 48-96 hours after online publication and is updated daily on week days.
Initial download of the metrics may take a while.