Fig. 2
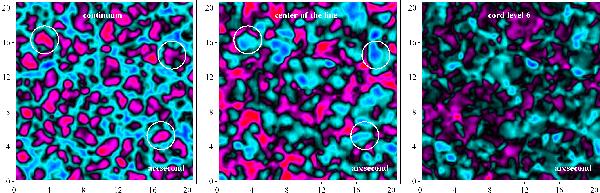
Reconstructed images of the granulation at three opacity levels in the 630.15 nm Fe i line. The geometrical scale is in arcseconds. Left panel: image at continuum level. Middle panel: image at line-center level. Right panel: image at line cord index 6 (close to the contrast inversion layer). Color code: the mean image intensity, Im is coded in black. The intensity range in each image is coded on 4 colors, showing respectively the levels [Im + (Imax − Im)/2;Imax] : red, [Im;Im + (Imax − Im)/2] : magenta, [Im − (Im − Imin)/2;Im] : cyan, [Im − (Im − Imin)/2;Imin] : blue. Imax and Imin denote respectively the maximum and minimum intensity in the image. The white circles show examples of structures exhibiting contrast inversion in the upper photosphere.
Current usage metrics show cumulative count of Article Views (full-text article views including HTML views, PDF and ePub downloads, according to the available data) and Abstracts Views on Vision4Press platform.
Data correspond to usage on the plateform after 2015. The current usage metrics is available 48-96 hours after online publication and is updated daily on week days.
Initial download of the metrics may take a while.