Fig. 9
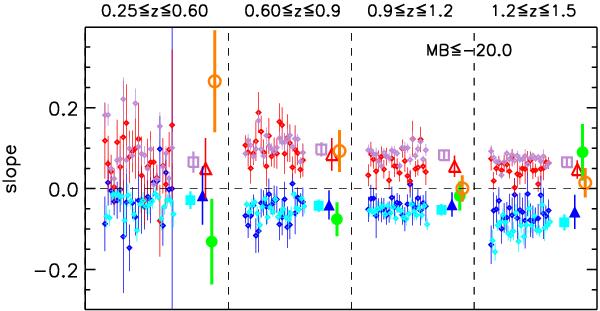
Slopes of the colour − density relation linear fits for the 23 Cmocks and the 23 Omocks for galaxies with MB ≤ −20 in the four redshift bins (label on the top), as in the third row of Figs. 7 and 8. Red and blue small diamonds: red and blue galaxies in each Omock; light purple and cyan small diamonds: red and blue galaxies in each Cmock. Red and blue big triangles: mean values of red and blue small diamonds, with the vertical error bar being the rms among all 23 mock samples. Light purple and cyan big squares: mean values of light purple and cyan small diamonds, with their rms. Orange and green circles: slope and its error for VVDS observed data (from C06) for red and blue galaxies, respectively.
Current usage metrics show cumulative count of Article Views (full-text article views including HTML views, PDF and ePub downloads, according to the available data) and Abstracts Views on Vision4Press platform.
Data correspond to usage on the plateform after 2015. The current usage metrics is available 48-96 hours after online publication and is updated daily on week days.
Initial download of the metrics may take a while.