Fig. 7
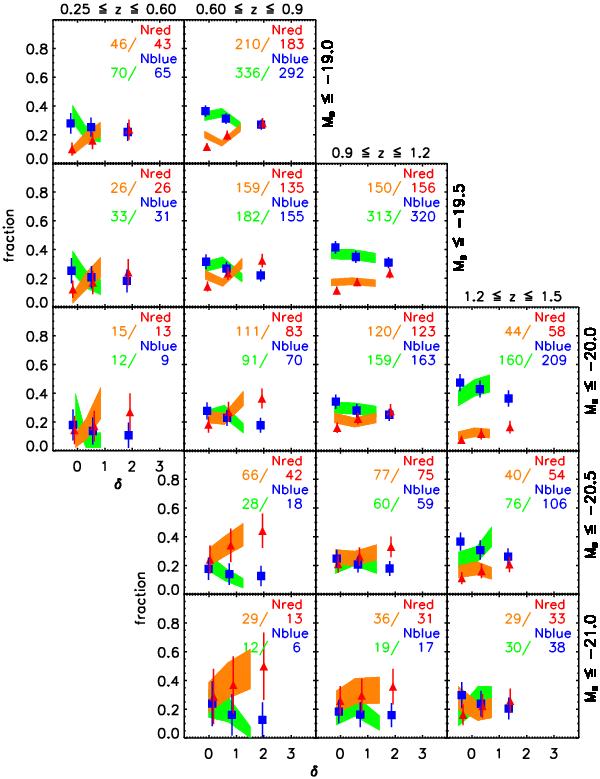
Colour − density relation in Omocks: blue squares represent the fraction of blue galaxies (fblue) and red triangles the fraction of red ones (fred). x- and y-axis positions are mean values of the x- and y-axis values for the 23 mock samples. Vertical error bars include the scatter among the 23 cones and the typical (mean) error in each cone on the computation of fblue or fred. Orange and green contours represent fred and fblue in the VVDS sample (from C06). The numbers quoted in each panel are the total number of red and blue galaxies in the VVDS data and in the mock samples (average on the 23 cones), with the same colour-code as for the symbols. For VVDS observed data we define red galaxies as those with (u∗ − g′) ≥ 1.1 and blue galaxies as those with (u∗ − g′) ≤ 0.55 at all z and for all luminosities. In the mock samples, the definition of red and blue galaxies varies with z and luminosity so that there is the same fraction of red and blue galaxies as in the VVDS (irrespectively of environment) in each redshift bin and for each luminosity limit (see the blue arrows in Fig. 5).
Current usage metrics show cumulative count of Article Views (full-text article views including HTML views, PDF and ePub downloads, according to the available data) and Abstracts Views on Vision4Press platform.
Data correspond to usage on the plateform after 2015. The current usage metrics is available 48-96 hours after online publication and is updated daily on week days.
Initial download of the metrics may take a while.