Fig. 6
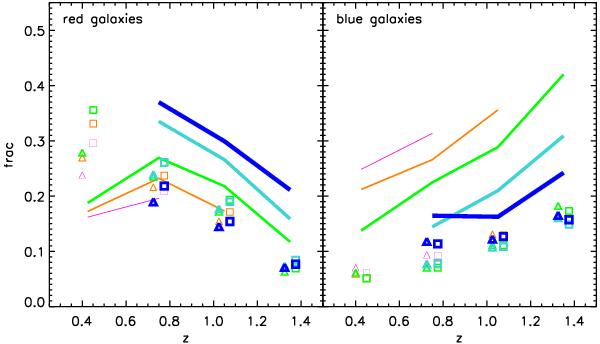
Fraction of red ((u∗ − g′) ≥ 1.1, left panel) and blue ((u∗ − g′) ≤ 0.55, right panel) galaxies as a function of redshift for different luminosity thresholds. Lines are for VVDS data, triangles for Omocks, and squares for Cmocks. The colour/thickness code is the following: from magenta/thin to blue/thick we consider galaxies with (MB − 5log h) ≤ −19.0, −19.5, −20.0, −20.5, −21.0. Each triangle(/square) represents the mean value of all Omocks(/Cmocks).
Current usage metrics show cumulative count of Article Views (full-text article views including HTML views, PDF and ePub downloads, according to the available data) and Abstracts Views on Vision4Press platform.
Data correspond to usage on the plateform after 2015. The current usage metrics is available 48-96 hours after online publication and is updated daily on week days.
Initial download of the metrics may take a while.