Fig. 5
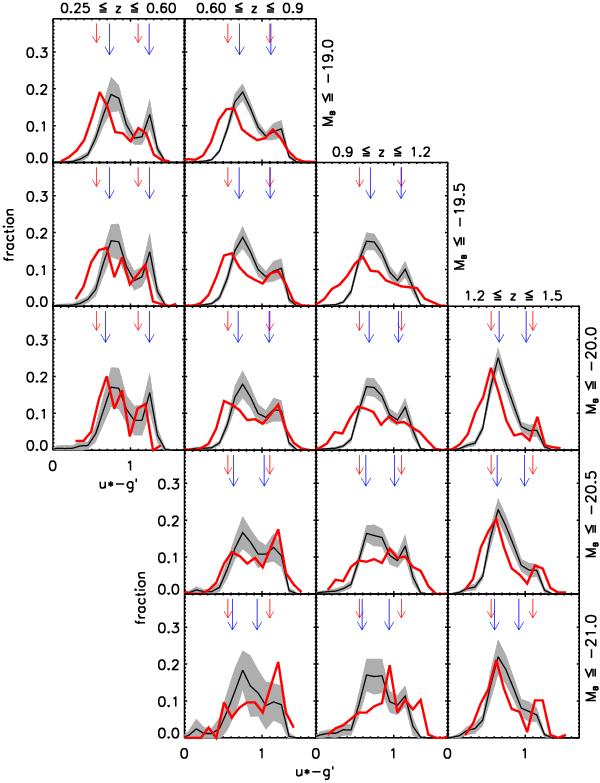
Colour distribution in the different redshift bins and luminosity limits. Red thick solid line: VVDS sample; black thin solid line: average of the Omocks; grey area: 1-σ scatter of Omocks. Red short arrows represent the fixed colour cuts used to define red ((u∗ − g′) ≥ 1.1) and blue ((u∗ − g′) ≤ 0.55) galaxies in C06. Blue long arrows indicate which colour cuts should be used in the mock samples to achieve the same percentage of red and blue galaxies (irrespectively of environment) as in the VVDS for each redshift bin and luminosity limit.
Current usage metrics show cumulative count of Article Views (full-text article views including HTML views, PDF and ePub downloads, according to the available data) and Abstracts Views on Vision4Press platform.
Data correspond to usage on the plateform after 2015. The current usage metrics is available 48-96 hours after online publication and is updated daily on week days.
Initial download of the metrics may take a while.