Free Access
Fig. 4
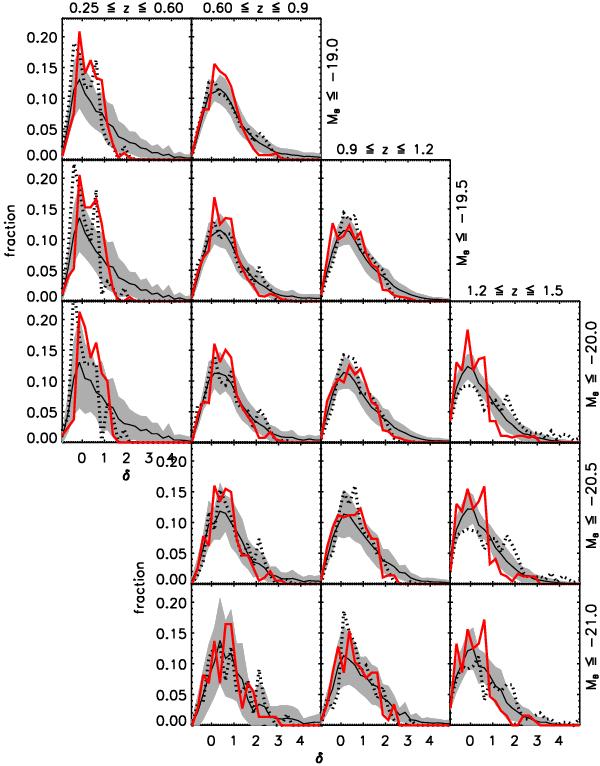
Density contrast distribution in the different redshift bins and luminosity limits. Red thick solid line: VVDS sample; black dotted line: Omock with lowest number counts; black thin solid line: average of the Omocks; grey area: 1-σ scatter of Omocks.
Current usage metrics show cumulative count of Article Views (full-text article views including HTML views, PDF and ePub downloads, according to the available data) and Abstracts Views on Vision4Press platform.
Data correspond to usage on the plateform after 2015. The current usage metrics is available 48-96 hours after online publication and is updated daily on week days.
Initial download of the metrics may take a while.