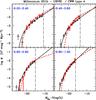
Fig. 3
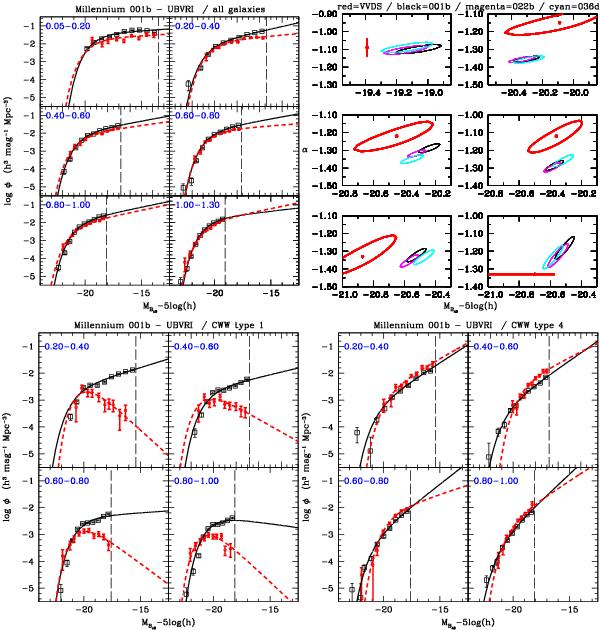
Evolution of the luminosity function of galaxies in the mock samples compared to the results from the VVDS. Upper left panel: evolution of the luminosity function in the B-band for all galaxies in the Cmock 001b. Each panel refers to a different redshift bin, which is indicated in the label. The vertical dashed line represents the faint absolute limit considered in the STY estimate. The luminosity functions are estimated with different methods (see text for details) but for clarity we plot only the results from C + (symbols) and STY (lines). Red filled circles and lines are used for observational measurements while black empty squares and lines are used for the corresponding measurements from the Cmock. Upper right panel: 68% confidence ellipses for the α and M∗ parameters obtained using all galaxies in Cmock 001b (black ellipse), Cmock 022b (magenta ellipse), and Cmock 036d (cyan ellipse). The red thicker ellipse corresponds to the VVDS measurements; the red thick lines in the first and the last redshift bins show the uncertainties on one of the parameters obtained keeping the other fixed. Lower left panel: evolution of the luminosity function in the B-band for type 1 galaxies in the Cmock 001b. Lines and symbols have the same meaning as in the upper left panel. Lower right panel: evolution of the luminosity function in the B-band for type 4 galaxies in the Cmock 001b. Lines and of symbols have the same meaning as in the upper left panel.
Current usage metrics show cumulative count of Article Views (full-text article views including HTML views, PDF and ePub downloads, according to the available data) and Abstracts Views on Vision4Press platform.
Data correspond to usage on the plateform after 2015. The current usage metrics is available 48-96 hours after online publication and is updated daily on week days.
Initial download of the metrics may take a while.