Fig. 2
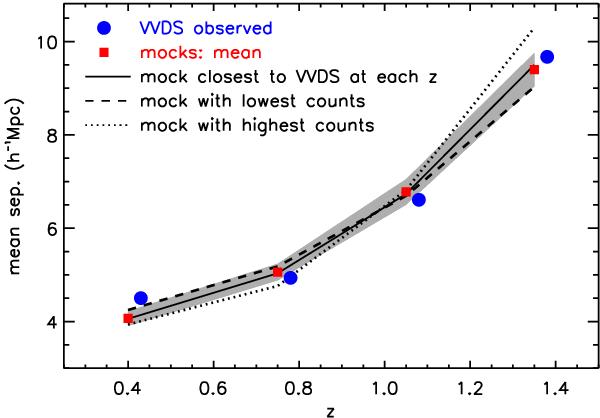
Mean intergalaxy separation as a function of redshift in the four redshift bins used in C06 (0.25−0.6, 0.6−0.9, 0.9−1.2, 1.2−1.5). Red squares are the mean among the 23 Omocks used in this study, and the grey shaded area shows the 1 − σ scatter. Blue circles are for VVDS data. The thick solid line corresponds to the Omock with mean intergalaxy separation closest to the VVDS measurements at all redshift bins considered. The dashed line corresponds to the Omock with lowest number counts (in the total redshift range 0.25 − 1.5), and the dotted line to the Omock with highest number counts.
Current usage metrics show cumulative count of Article Views (full-text article views including HTML views, PDF and ePub downloads, according to the available data) and Abstracts Views on Vision4Press platform.
Data correspond to usage on the plateform after 2015. The current usage metrics is available 48-96 hours after online publication and is updated daily on week days.
Initial download of the metrics may take a while.