Fig. 12
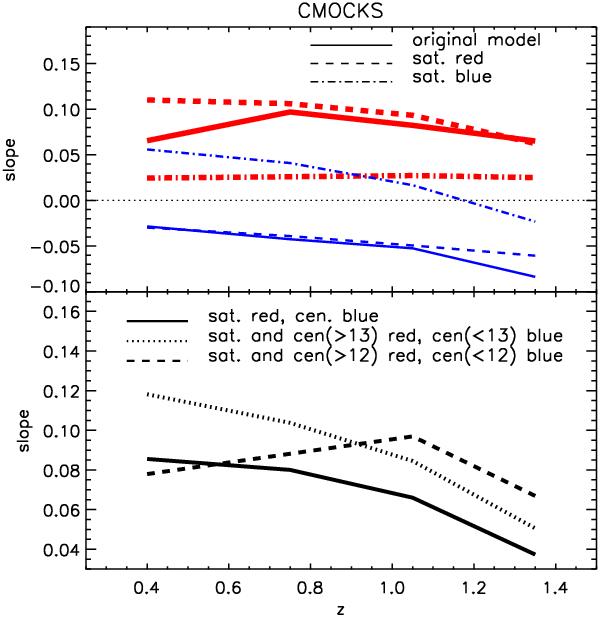
Top panel. Slope of the linear fit of the fred-density relation (thick red lines) and of the fblue-density relation (thin blue lines) as a function of redshift in Cmocks. Only galaxies with MB ≤ −20 are considered. Solid line: slopes as found in the model, the same as in Fig. 10. Dashed and dot-dashed lines: slopes for two different assumptions about the colour distributions of satellite galaxies. We assume that centrals galaxies have the same colour as in the model, but now we assume that satellites are either all red (dashed line) or all blue (dot-dashed line). Bottom panel. Slope of the linear fit of the fred-density relation as a function of redshift in Cmocks, for three different assumptions about the colour distributions of central and satellite galaxies. Solid line: all satellites are red, and all centrals are blue. Dotted line: all satellites and centrals residing in DM halos with virial mass ≥ 1013 M⊙ / h are red, while all other centrals are blue. Dashed line: like the dotted line, but in this case the red centrals are those residing in DM halos with virial mass ≥ 1012 M⊙ / h. For this plot we use the 23 Cmocks together, and we keep fsat increasing with δ and decreasing with z as we find in the mock samples.
Current usage metrics show cumulative count of Article Views (full-text article views including HTML views, PDF and ePub downloads, according to the available data) and Abstracts Views on Vision4Press platform.
Data correspond to usage on the plateform after 2015. The current usage metrics is available 48-96 hours after online publication and is updated daily on week days.
Initial download of the metrics may take a while.