Fig. 11
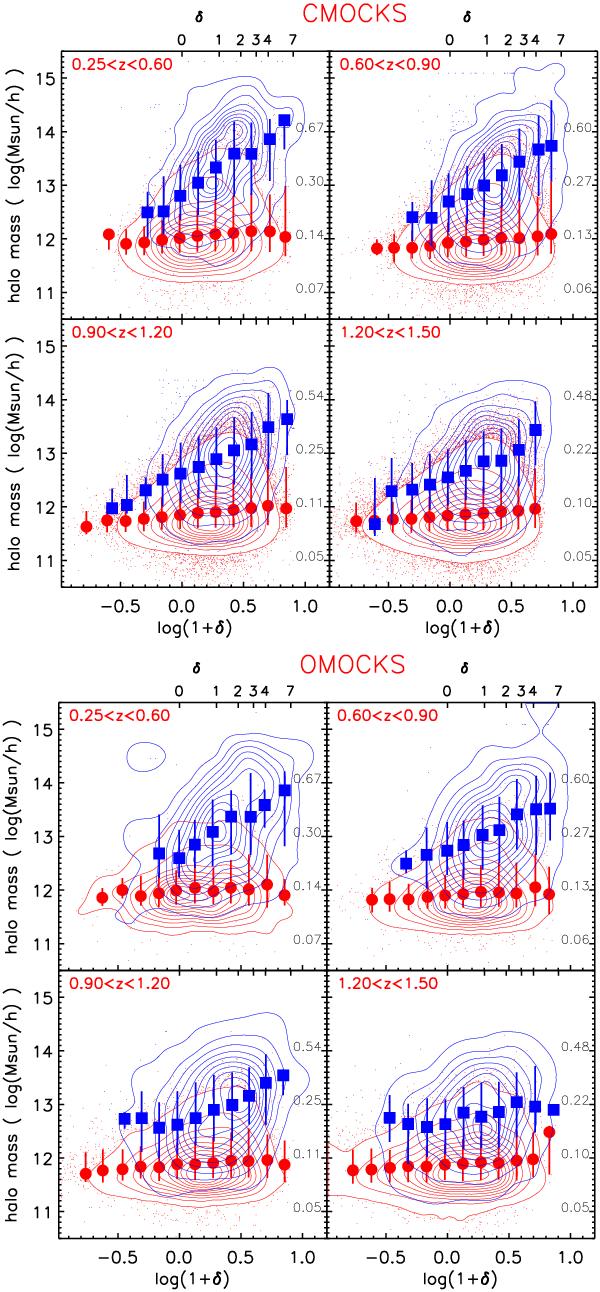
Total halo mass as a function of the local density contrast computed in this work in different redshift bins (as in the labels) for galaxies with MB ≤ − 20. The values of the density contrast are indicated as log (1 + δ) in the bottom x-axis and as δ in the top x-axis. The halo is the FOF halo in which the galaxy reside (the halo of the group/cluster of which the galaxy is member). Four top panels: Cmocks. Four bottom panels: Omocks. Red circles and contours refer to central galaxies, blue squares and contours to satellite galaxies. Each panel includes all the 23 mock samples. Lines represent the isodensity contours of all the galaxies in the panel. For clarity, single galaxies are plotted as small dots only outside the lowest density contour. Filled red circles (/blue squares) are the median values in density bins for central (/satellite) galaxies. The error bars represent the 16% and 84% of the halo mass distribution in each density bin. On the right vertical axis of each panel, we show the typical virial radius (in h-1 Mpc) corresponding to the halo mass on the left vertical axis.
Current usage metrics show cumulative count of Article Views (full-text article views including HTML views, PDF and ePub downloads, according to the available data) and Abstracts Views on Vision4Press platform.
Data correspond to usage on the plateform after 2015. The current usage metrics is available 48-96 hours after online publication and is updated daily on week days.
Initial download of the metrics may take a while.