Fig. 4
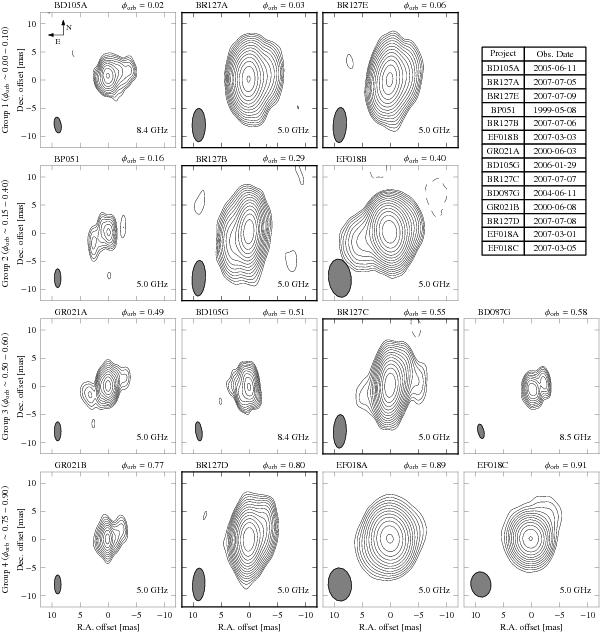
VLBI self-calibrated images of LS 5039 at 5.0 and 8.5 GHz (see Table 4 for details on the projects). The plotting parameters are the same as in Fig. 3. The panel order is in increasing orbital phase from left to right and from top to bottom, and the images have been grouped according to similar morphological features. The project code and orbital phase are quoted on the top part of each panel. The images from project BR127, obtained during the same orbital cycle, have bold axes. Dashed contours are plotted at −3 times the rms noise of each image and solid contours start at 3 times the rms and scale with 21/2, except for GR021A-B and BP051, which start at 5σ as in the original publications. The rms noise of each image can be found in Table 4.
Current usage metrics show cumulative count of Article Views (full-text article views including HTML views, PDF and ePub downloads, according to the available data) and Abstracts Views on Vision4Press platform.
Data correspond to usage on the plateform after 2015. The current usage metrics is available 48-96 hours after online publication and is updated daily on week days.
Initial download of the metrics may take a while.