Fig. 3
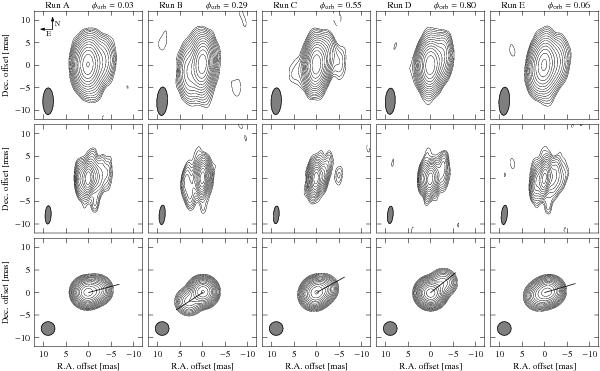
VLBA images of LS 5039 at 5 GHz from project BR127, obtained during five consecutive days in July 2007. Each column, labelled with the run name and orbital phase, corresponds to one epoch (see Table 1). For each epoch, the first and second rows correspond to the self-calibrated images obtained with a natural and uniform weighting scheme, respectively. The third row shows the uv components fitted to the data, convolved with a Gaussian circular beam with an area equal to the average synthesized beam of all images. The lines show the direction of the main extended component. The restoring beams are plotted in the bottom-left corner of each panel. Dashed contours are plotted at − 3 times the rms noise of each image and solid contours start at 3 times the rms and scale with 21/2. The Gaussian components fitted to the images are listed in Table 3.
Current usage metrics show cumulative count of Article Views (full-text article views including HTML views, PDF and ePub downloads, according to the available data) and Abstracts Views on Vision4Press platform.
Data correspond to usage on the plateform after 2015. The current usage metrics is available 48-96 hours after online publication and is updated daily on week days.
Initial download of the metrics may take a while.