Fig. 2
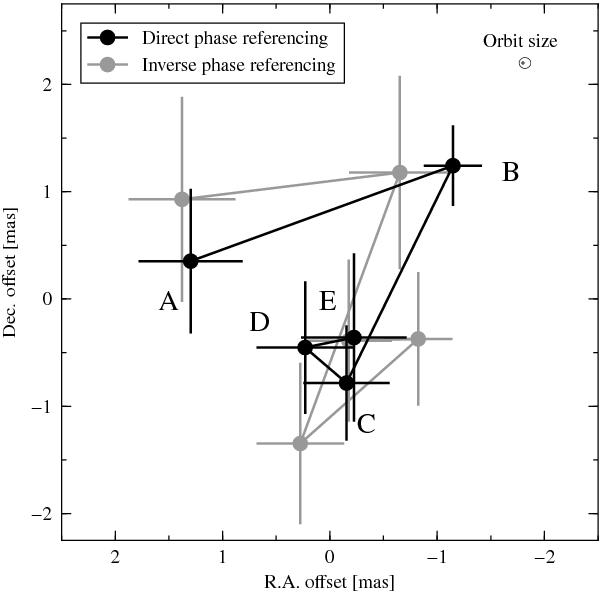
Relative offsets of the peak of the emission of LS 5039 during five consecutive days with respect to the average position. For straightforward comparison, we plot the opposite value of the inverse astrometry. The run label is displayed close to each direct measure. The size of the binary system is indicated by the small orbit in the corner, which is plotted face-on and with an arbitrary orientation. The displacements and uncertainties are shown in Table 2.
Current usage metrics show cumulative count of Article Views (full-text article views including HTML views, PDF and ePub downloads, according to the available data) and Abstracts Views on Vision4Press platform.
Data correspond to usage on the plateform after 2015. The current usage metrics is available 48-96 hours after online publication and is updated daily on week days.
Initial download of the metrics may take a while.