Fig. 6
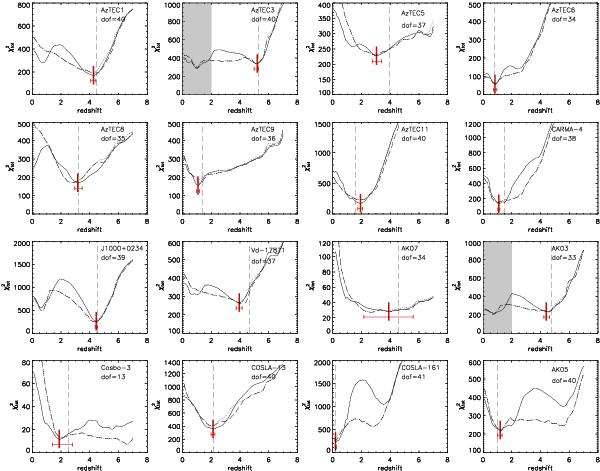
Photometric redshift total χ2 distributions for our SMGs with spectroscopic redshifts. We show results based on various sets of spectral models (see text for details): 2T (dotted lines), 6T (dashed-lines), M (full lines). The spectroscopic redshifts are indicated by vertical dashed lines. The source names and the number of degrees of freedom (dof) in the photometric redshift χ2 minimization are indicated in each panel. The gray-shaded areas in some of the panels indicate the redshift range ignored for the determination of the best-fit photometric redshift. The photometric redshift provided by the best model (M) and its uncertainty was taken as the minimum χ2 value and the 99% confidence interval, respectively, both indicated in each panel by the thick and thin red lines.
Current usage metrics show cumulative count of Article Views (full-text article views including HTML views, PDF and ePub downloads, according to the available data) and Abstracts Views on Vision4Press platform.
Data correspond to usage on the plateform after 2015. The current usage metrics is available 48-96 hours after online publication and is updated daily on week days.
Initial download of the metrics may take a while.