Fig. 10
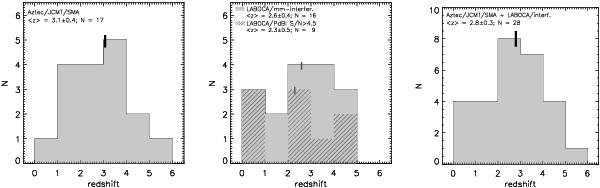
Redshift distribution of our 1.1 mm-selected sample (left panel), 870 μm-selected sample (middle panel), and the two samples combined (with sources present in both samples counted only once; right panel). In the middle panel we also show the redshift distribution of our S/N1.1 mm > 4.5 PdBI-detected LABOCA sample (hatched histogram). Mean redshift values, and corresponding errors obtained using the statistical package ASURV, as well as the number of sources in each sample are indicated in each panel. Mean redshifts for every sample distribution are also indicated by the thick vertical lines.
Current usage metrics show cumulative count of Article Views (full-text article views including HTML views, PDF and ePub downloads, according to the available data) and Abstracts Views on Vision4Press platform.
Data correspond to usage on the plateform after 2015. The current usage metrics is available 48-96 hours after online publication and is updated daily on week days.
Initial download of the metrics may take a while.