Fig. 16
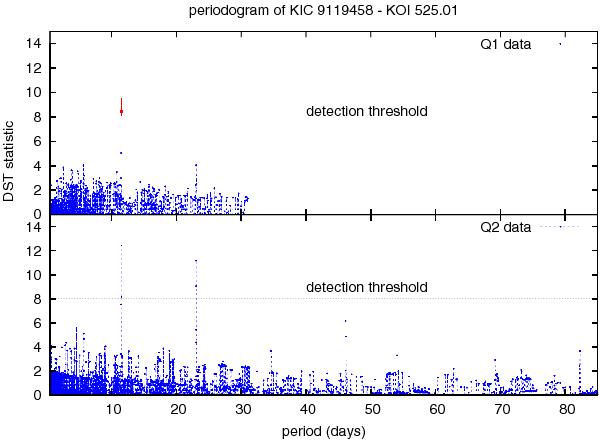
Periodogram of KIC 9119458. The upper part corresponds to the analysis of the data set Q1 and the peak of the candidate 525.01 is marked with an arrow. Its height is 5.4, well below the detection threshold. The lower part corresponds to the analysis of the data set Q2, where the height of the peak is 12.8 (see discussion in text).
Current usage metrics show cumulative count of Article Views (full-text article views including HTML views, PDF and ePub downloads, according to the available data) and Abstracts Views on Vision4Press platform.
Data correspond to usage on the plateform after 2015. The current usage metrics is available 48-96 hours after online publication and is updated daily on week days.
Initial download of the metrics may take a while.