Fig. 11
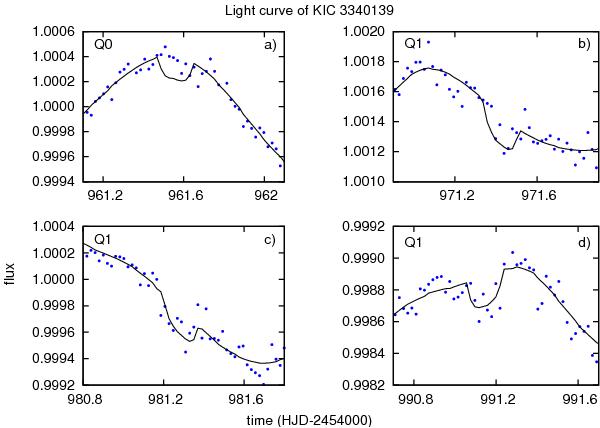
Detail of the light curve of KIC 3340139 observed in the Q0 and Q1 Kepler quarters. The continuous line represents the model of stellar activity together with the transit solution found by DST. Panels b)–d) show residuals of stellar activity that mimic a periodic transit feature. Panel a) shows the expected position of the transit in Q0 data.
Current usage metrics show cumulative count of Article Views (full-text article views including HTML views, PDF and ePub downloads, according to the available data) and Abstracts Views on Vision4Press platform.
Data correspond to usage on the plateform after 2015. The current usage metrics is available 48-96 hours after online publication and is updated daily on week days.
Initial download of the metrics may take a while.