Fig. 7
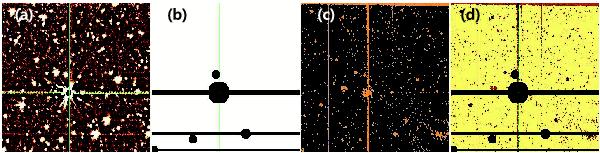
Schematic diagram describing the procedures used to make a weight map for an individual frame obtained from a single pointing observation. The first panel a) is a sample image containing a bleeding trail and a bright source whose center is disrupted. The second panel b) shows the regions to be masked. The third panel c) represents the number of rejected frames during the stacking procedure. Each pixel has an integer value ranging 0 to 3. The last panel d) is a weight map to be used for the final mosaicking procedure.
Current usage metrics show cumulative count of Article Views (full-text article views including HTML views, PDF and ePub downloads, according to the available data) and Abstracts Views on Vision4Press platform.
Data correspond to usage on the plateform after 2015. The current usage metrics is available 48-96 hours after online publication and is updated daily on week days.
Initial download of the metrics may take a while.